

TEAM & ROLES

Xavier Jauregui
(Vice President)
Oversaw the agile progress of the 3-17 product.

Allan Hutchinson (Regional Manager)
Operated as a sponsor user with feedback.

Oszkar Santa (Global Product Manager)
Managed global stakeholders and requests.
Wolfram Donat (Software Developer)
Managed API calls and back-end functionality.

Wedge Oldham (Chief Software Engineer)
Created back-end functionality and servers.

Stephan Themis (Front-End Developer)
Drafted the front-end designs and interactions.
1. understand / product thinking
I was part of an engineering team that was responsible for new iterations for the company’s product launch. The problem we were trying to solve was to create a feature where our welders had visibility on the quality of their welding process. I led the product design process trying to gauge the following:
1) People Problem
Welders have limited access to determine how their welding process is due to clunky outdated systems.
2) How do we know this is a problem?
Customers reviews and complaints about having a lack of resource to track their weld, but also more millennial welders are joining the working force. Company needs to adapt to some visual, trendy model for that demographic.
3) How do we know if we succeed?
Testing the feature amongst internal users for both millennials and senior users.
2. design Strategy
auditing the product / identify what’s missing
WHAT IS THE CURRENT EXPERIENCE?
To get a better understanding of the product, I did an overview audit to first analyze design inconsistencies with pixels and features.
From the audit, the SaaS program was lacking the following:
Poor Icon Identity: Icons do not identify clearly what it does.
Pixel Spacing: Elements are not evenly spaced throughout the UI.
Competitor Analysis
HOW DO WE DIFFER FROM CURRENT COMPETITORS IN THE MARKET?
I met with the AMI stakeholders and discussed how the 3-17 would be able to compete in the current landscape. I learned what the company was aiming for their product strategy and identified the commonalities was icons to indicate users on how the product is functioning.

Ramp and orbital visuals are a key element for welders. Inspiration to create a new display.

Icons are also a key factor. Inspiration to convey 2D or 3D elements into the product.
UNDERSTANDING THE USER JOURNEY.
I was given the customer journey map from another agency (Nectar), to compare if there were any changes between a novice welder to a traditionalist welder.


a/b Testing
HOW DOES THE PRODUCT WORK CURRENTLY AND HOW WOULD ANALYTICS FIT IN?
Allan stopped by the office to test the 3-17 product. Below were the main takeaways I learned before heading into iteration.
Technical Assets Needs Fixing: Machine is not properly striking electrical arcs, failing to create a good weld.
Customization Made Easy: Machine eases welder’s process with scheduling, logging in, and tracking values.
Veteran Welders Can Adapt to Digital: Seasoned welders are able to use as long as the welding language and visual identity is familiar to them.
Documentation: Veteran welders or supervisors need a way to track their data of welds.
3. DESIGN EXECUTION
HOW TO DESIGN A SIMPLE WAY TO READ DATA?
Based on the strategy, I approached the following design principles for this project:
Support & Control: Welders should be able to access previous data of past welds, change values, and control levels of welding.
Visual Consistency: Information throughout the UI should be clear and concise for a welder to perform actions.
Familiarity: Terminologies have to be easily detected for welders to access based on their certified training.
IDEATION
DESIGN STUDIO & WIREFRAMES
I worked with Xavier on improving two specific features for the 3-17, Jogs Display and Data Analytics, which was a priority after feedback from our first A/B Test. I developed my own sketches for both features and iterated them into high-fidelity to allow Xavier and Wolf see how the functionality would play out.

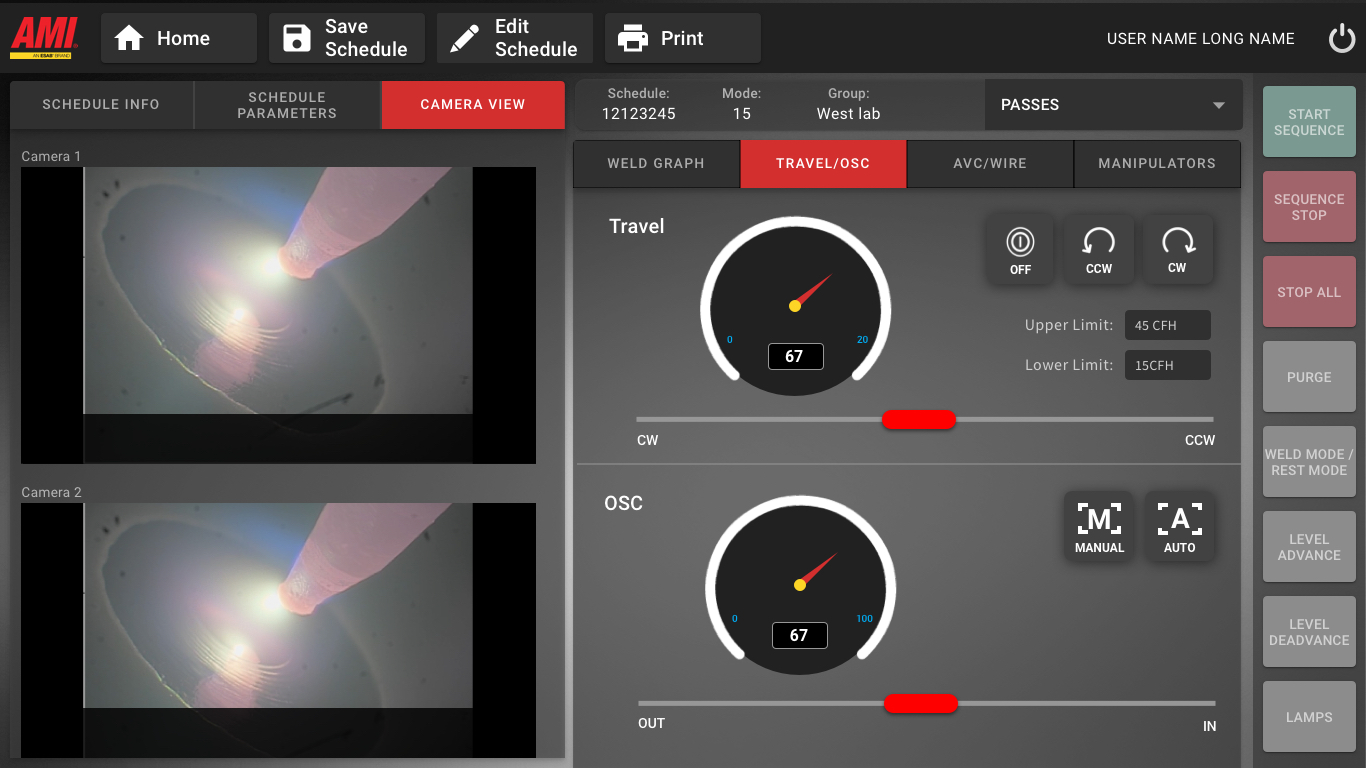
Jog Screens (Version 1) - Lacked depth and information on how fast the weld travels.

Implemented a meter illustration to allow welders track speed during the jogging process.

Implemented stock market design for specific tracking in moments during weld.
VISUAL DESIGN & Developer handoff
DESCRIBING THE FUNCTIONALITY’S JOURNEY
I forwarded my deliverables and cross-communicated with Stephan and Wolf on how the functionality would work. Both of them presented technical constraints with certain elements and I leveled their concerns with my understanding of the product by balancing what was feasible during our sprint timeline.
Style Guides
TYING IN STANDARD COLORS, BUT WITH AN INDUSTRIAL TONE & FEEL.
Style guide was previously created by Nectar, Xavier wanted to keep the same color scheme throughout the iteration.

4. OUTCOME AND TAKEAWAYS
AN INDUSTRIAL EXPERIENCE THAT IS MODERN AND UP TO DATE.
I was happy to see my designs implemented into the product and what I learned was that the company heavily relied consumer feedback through data and sponsor users to revamp the needs and features.
The native product has officially launched and is currently sold to various markets in the welding space with a trajectory of $2.7 billion.